
Insights
The Advantages of Disciplined Lower Middle Market Direct Lending
October 2024

Trevor Clark
Managing Partner,
TPG Twin Brook
tclark@twincp.com
Jeff Frank
Head of Capital
Solutions & Strategy,
TPG Twin Brook
jfrank@twincp.com
Gabe Lipton Galbraith
Vice President,
Client & Capital Formation,
TPG
ggalbraith@tpg.com
The Advantages of Disciplined Lower Middle Market Direct Lending
The growth of private credit and direct lending as an asset class has coincided with an expansion in the total addressable market of borrowers and the increased accessibility of opportunities to lend to companies of all sizes, including those across the Upper Middle Market (defined as companies with >$50M in annual EBITDA), Core Middle Market ($25-$50M), and Lower Middle Market (<$25M).
This naturally raises the question of where investors should prioritize putting money to work as they continue to allocate to direct lending. In particular, we hear a lot of debate about whether the Lower Middle Market (“LMM”) provides favorable and diversifying returns relative to the Upper Middle Market (“UMM”). So where should investors focus their attention?
We see a compelling case for investing behind experienced, disciplined Lower Middle Market lenders. Specifically, we believe growing competition and often lax lending standards have diminished returns across the UMM, and we would argue that the ability to lend into private equity-backed firms across the LMM provides an advantageous combination of higher returns, greater lender protections, and increased diversification.
Why LMM Direct Lending Is So Compelling:
#1. Less Competition, More Attractive Returns
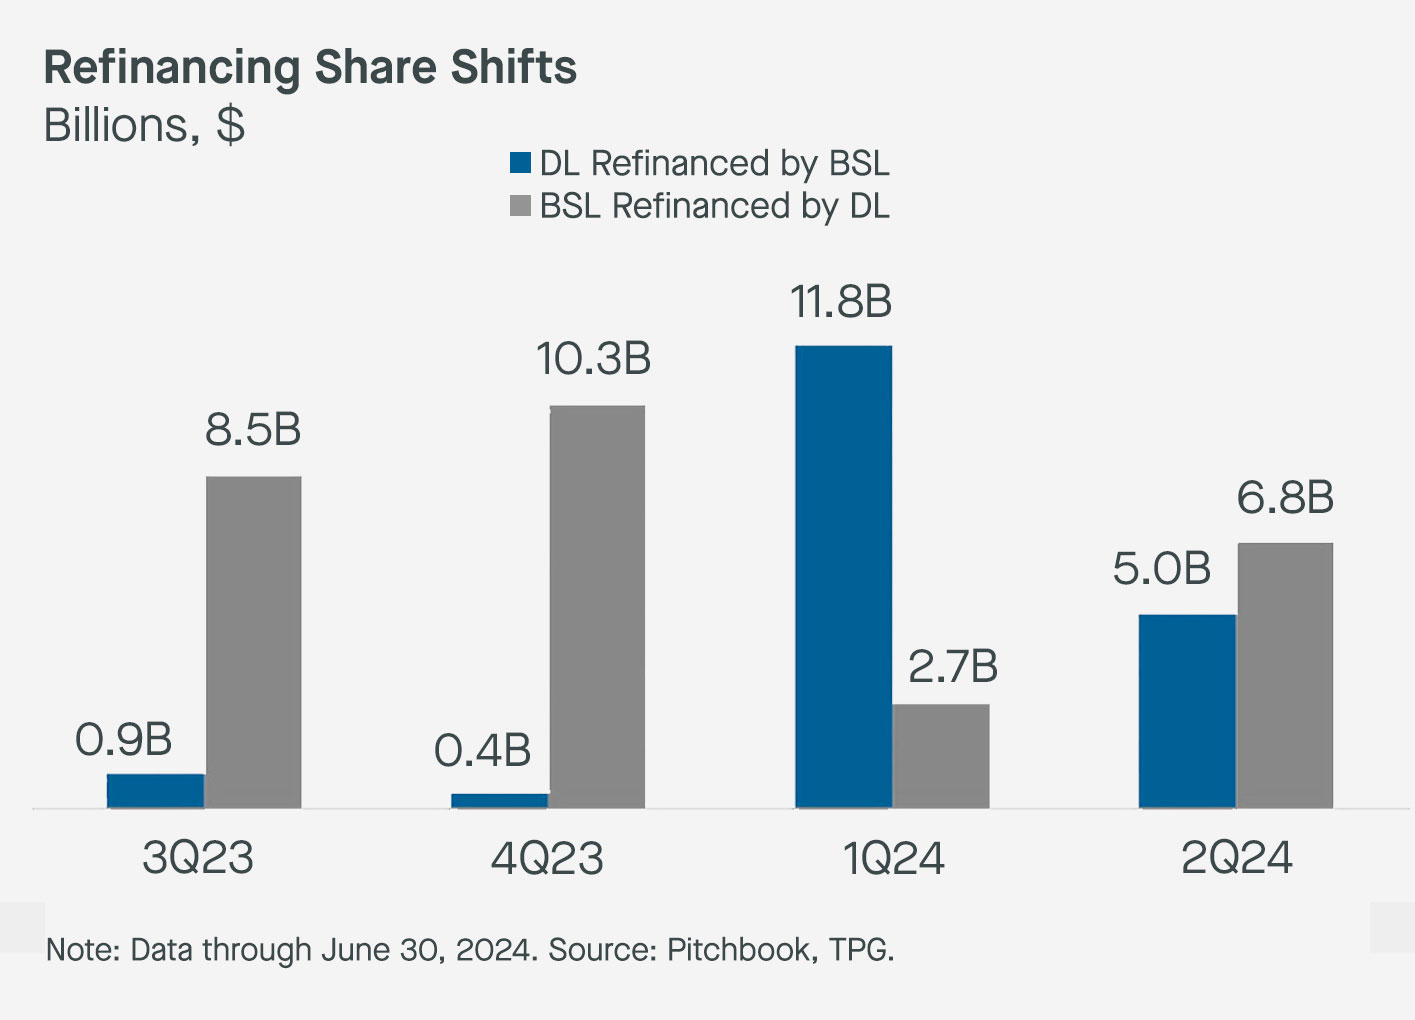
The fiercely competitive dynamics of the Upper Middle Market are evident in borrowers’ frequent pursuit of “dual track” processes in both the public broadly syndicated loan (BSL) market and private markets (see Exhibit 1) in search of the most favorable terms, which has eroded the spread between new lending direct issues and broadly syndicated loans.
Upper Middle Market lenders are often selected by a borrower based on their ability to offer the lowest price and highest leverage. In contrast, in the Lower Middle Market, price is only one of many borrower considerations, and private equity sponsors are selectively looking for a lender who can support their long-term growth plans for a company and act as a true partner over the life of a loan.
Exhibit 1: UMM Refinancing Swings Between The Public & Private Options
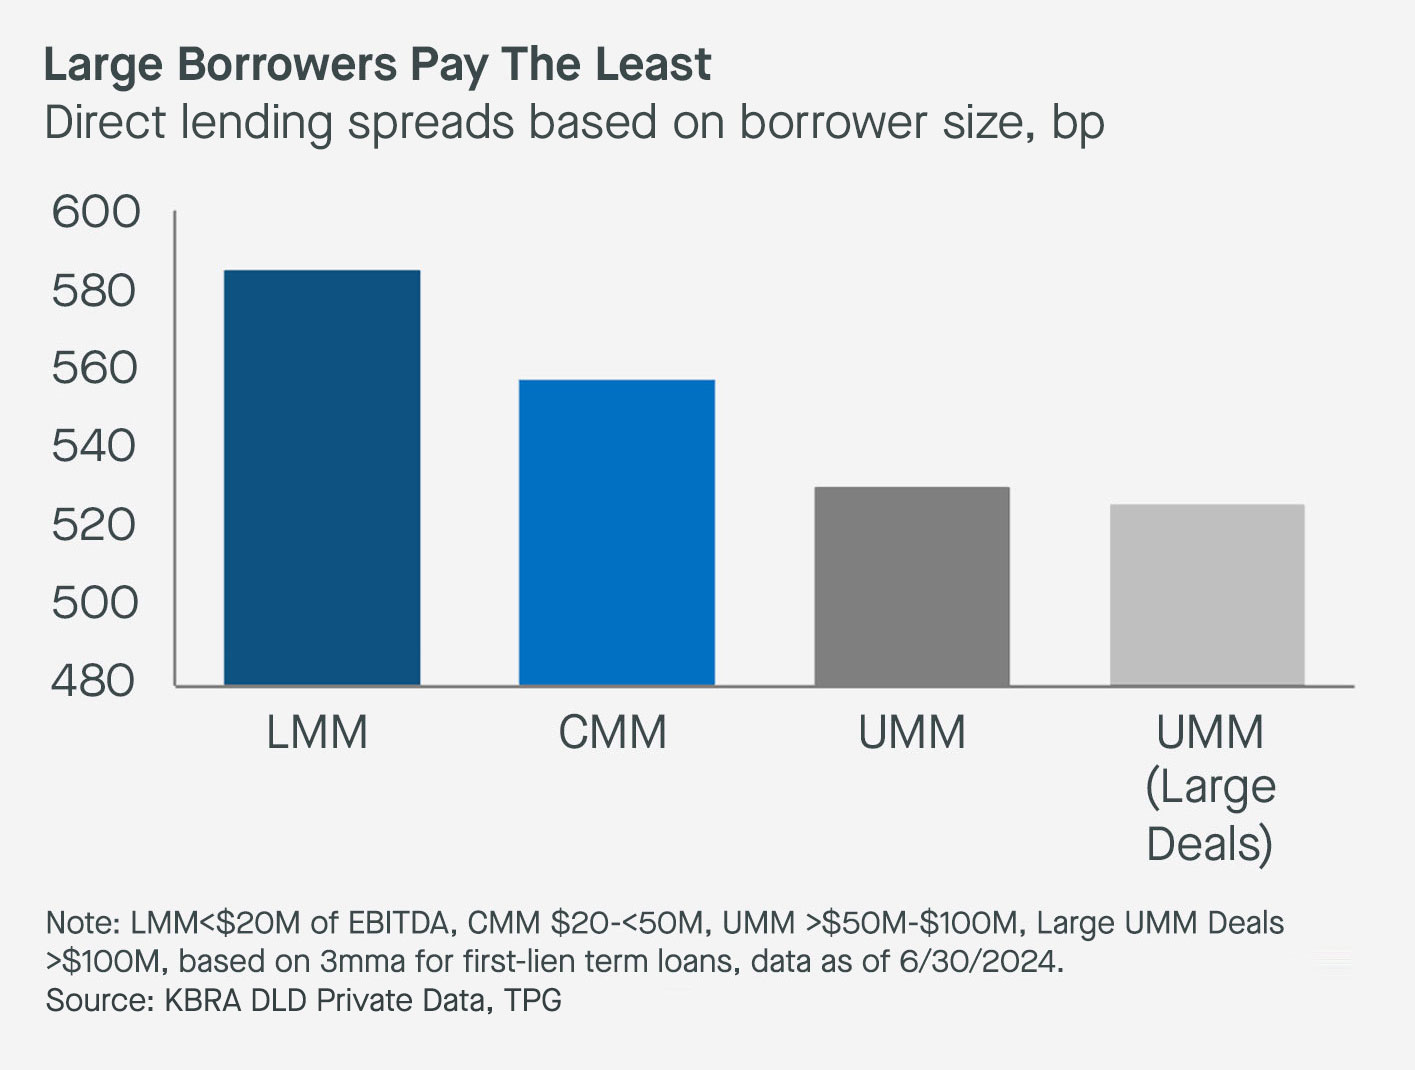
These relative competitive dynamics and the contraction in lending by smaller commercial banks have contributed to non-bank lenders being able to provide credit at wider spreads in the Lower Middle Market compared to the Upper Middle Market (see Exhibit 2).
Exhibit 2: The LMM Consistently Offers Higher Spreads
#2. Larger Opportunity, More Manager Alpha
We often hear the strawman argument that the “average” Upper Middle Market company has more cashflow stability than the “average” Lower Middle Market company. We think this notion misses the bigger picture because the entire Lower Middle Market universe includes a large concentration of start-up and early-stage companies that aren’t targets for the type of private equity-backed lending that many LMM direct lenders are engaged in.
Not only is the opportunity set larger in the LMM in terms of the total number of private equity-backed companies who are looking to borrow, but we believe lenders with experienced and scaled origination and underwriting teams can find LMM companies with cashflow production stability on par with the best UMM companies. This requires investing in top-quality talent within your own organization as a Lower Middle Market direct lender.
Moreover, part of the “manager alpha” in the LMM is having access to the best performing companies, which is achieved by building a track record of trust and partnership with the sponsor community over many years (and market cycles). It also involves creating a virtuous cycle of active borrower relationships to drive growth initiatives, including add-on financings.
#3. Lower Leverage, Less Risk
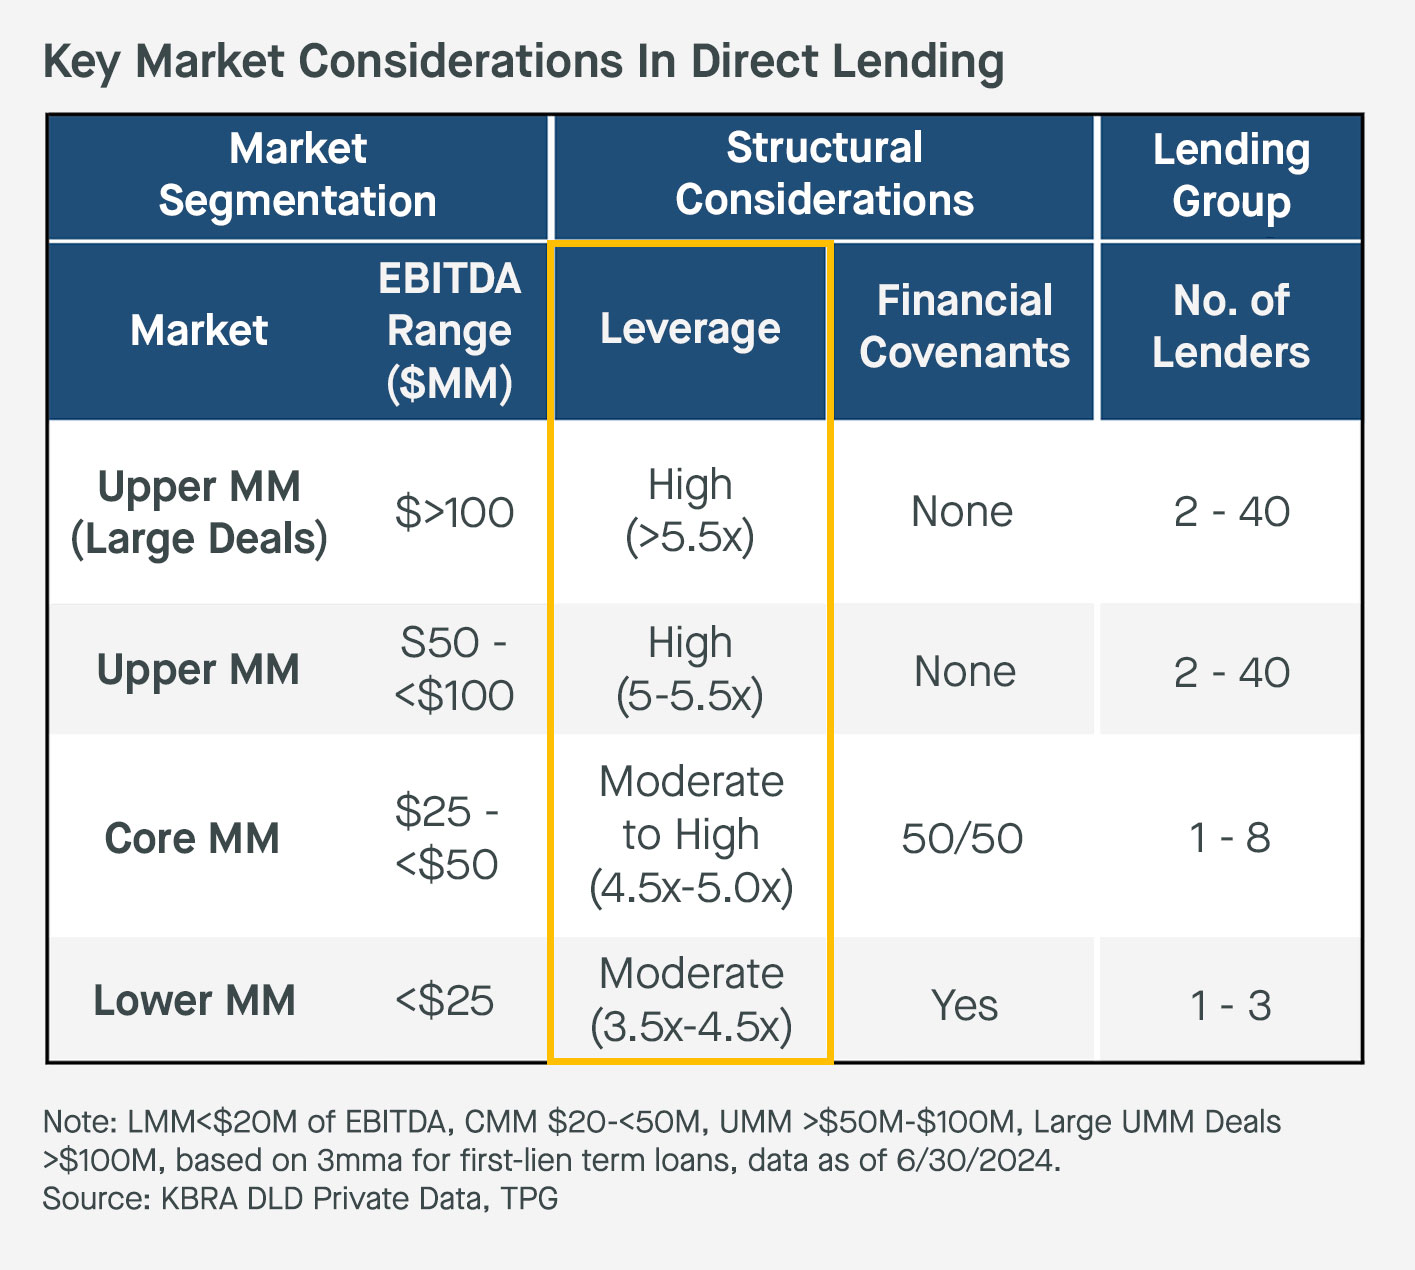
Beyond a larger addressable opportunity set, Lower Middle Market credit facilities have significant advantages over those in the Upper Middle Market. Lower Middle Market borrowers tend to have lower levels of leverage. Indeed, the leverage of private equity-backed LMM companies has hovered between 3.5-4.5x over the past few years, whereas leverage ratios of >5x are far more common in the UMM (see Exhibit 3).
Exhibit 3: Leverage Is Typically Higher in the UMM…
The regularity of higher debt loads in the context of larger companies also means that a far greater portion of their earnings has to be set aside to service interest payments (see Exhibit 4).
Exhibit 4: ...And UMM Interest Coverage Has Been Falling
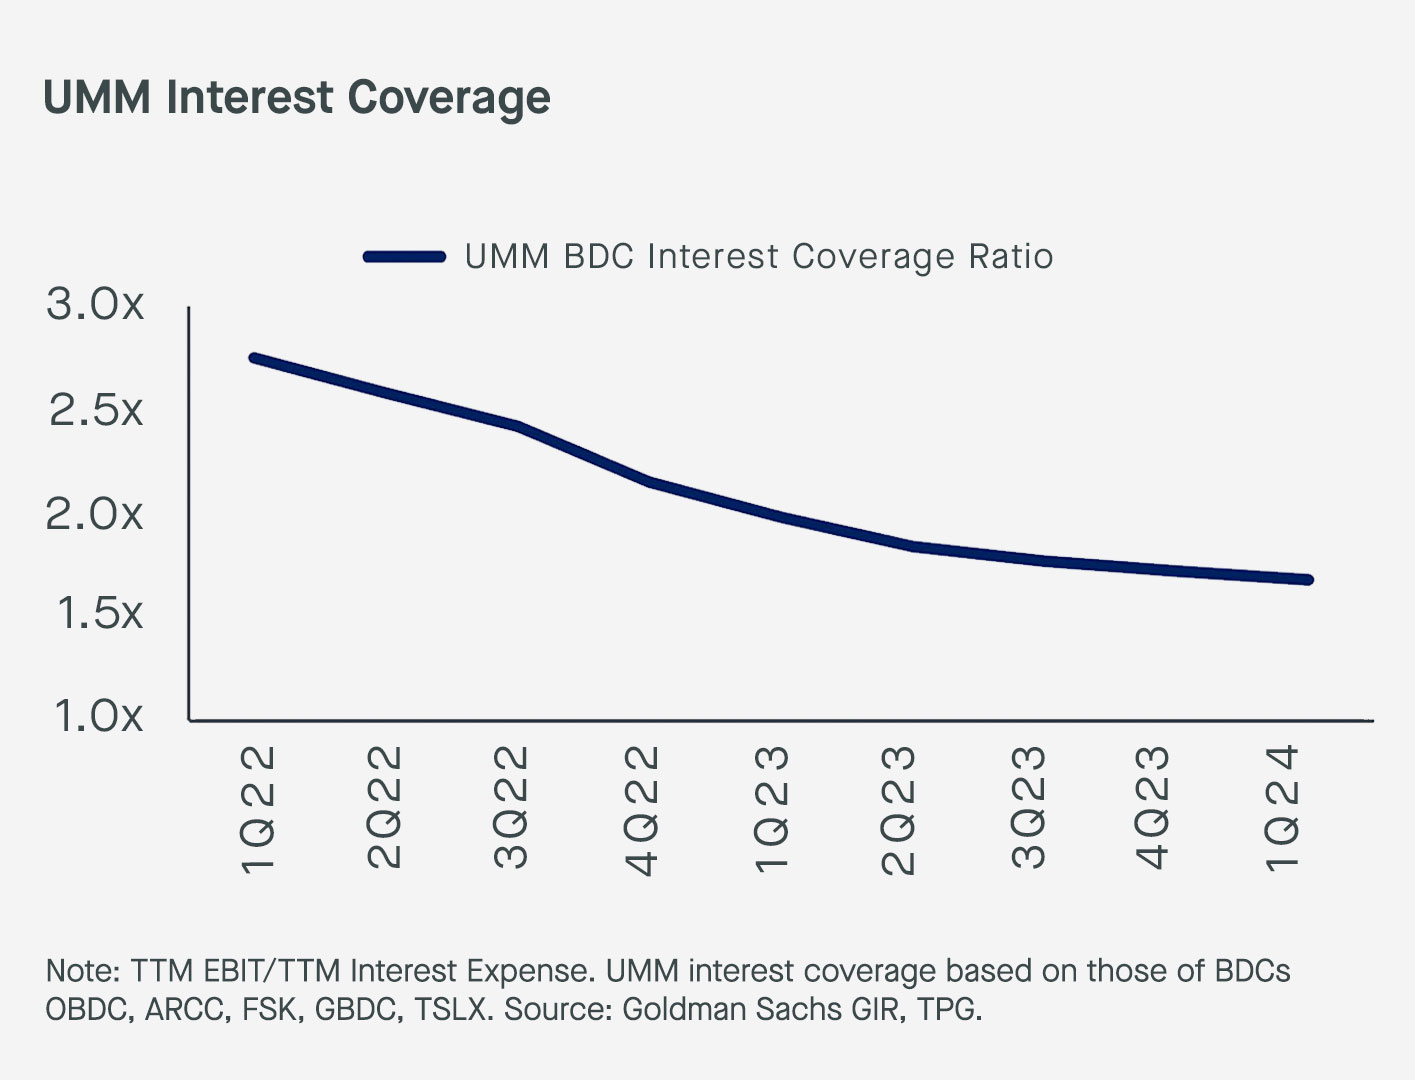
This combination of higher leverage and lower interest coverage suggests that the Upper Middle Market is inherently riskier from a capital structuring perspective, in our view, than the Lower Middle Market given a larger likelihood that borrowers will face trouble servicing their debts over time.
#4. Stronger Lender Protections
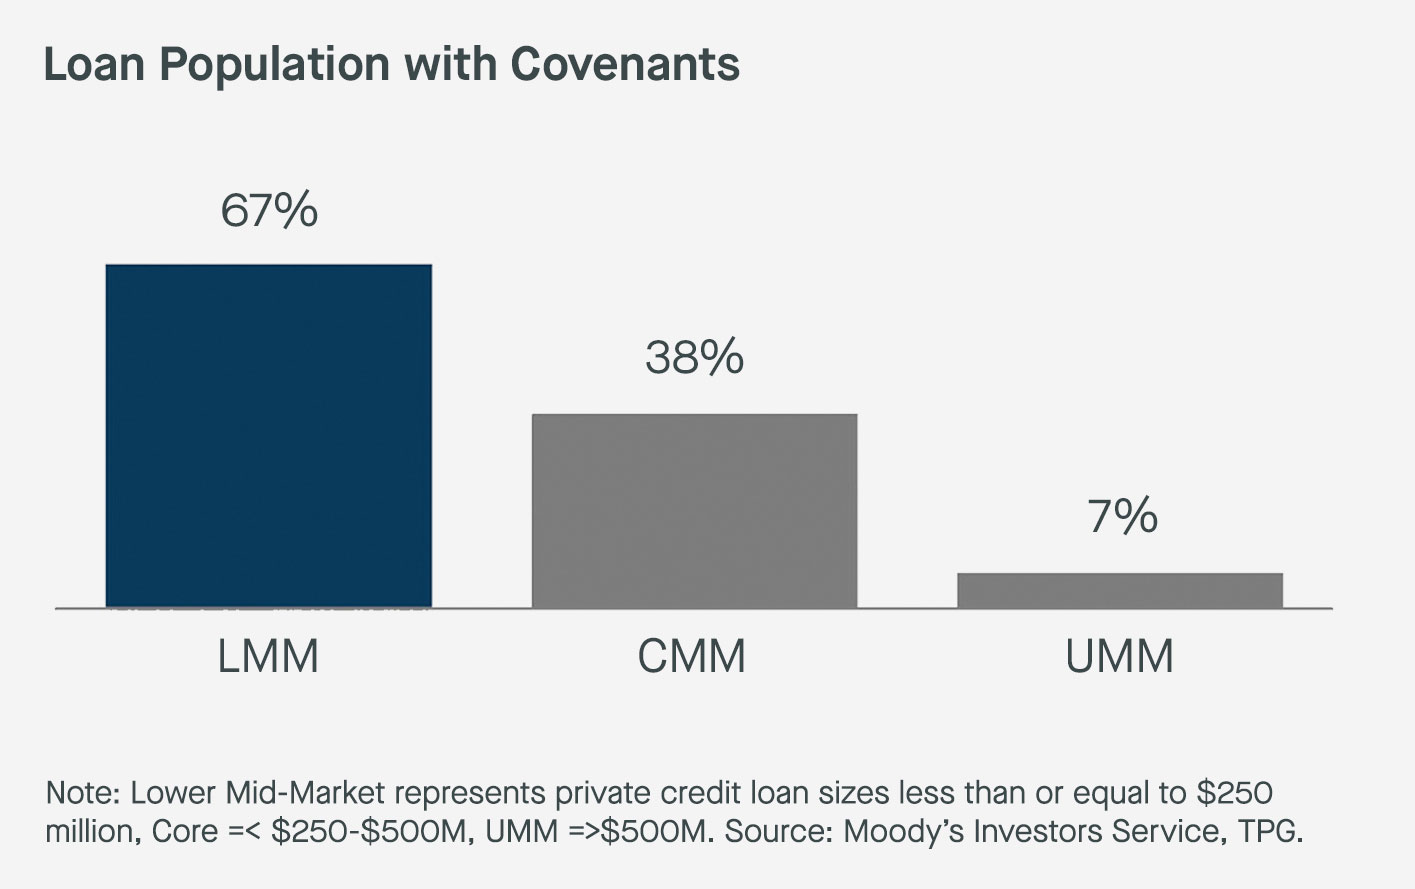
One consequence of the fiercer competition in the Upper Middle Market is a greater lack of lender protections and increased frequency of covenant-lite lending or loans with no covenants at all (see Exhibit 5).
As the administrative agent or co-lead arranger in most deals, LMM lenders benefit from direct communication with sponsors and the ability to drive documentation and lender protections as loans are made. In the UMM, it’s common to be part of large, multi-lender bank groups where many of the participants are term-takers and not heavily involved in constructing lender terms.
Exhibit 5: Covenants Are More Common In The LMM…
While the case is often made that the rate of covenant defaults is higher among smaller borrowers, indicating higher risk in the Lower Middle Market, we see four major flaws in this line of reasoning:
- First, the frequent lack of covenants in the Upper Middle Market would lead you to expect a lower number of covenant breaches all else equal. Driving in a car without safety belts doesn’t mean you’re safer because there are fewer cases of whiplash.
- Second, headline default figures ignore differences in the quality of covenants between the Lower and Upper Middle Market, including how financial ratios are defined or the relevant thresholds for determining that a breach has occurred. We would argue that the lower quality of UMM covenants means that an UMM portfolio could have the exact same underperformance as a LMM portfolio and have a lower incidence of defaults because of how credit agreements are constructed.
- Third, we view covenants not only as a form of meaningful lender protection but a safeguard that allows us to engage with a borrower on potential issues early while enterprise value remains. A better measure of whether covenants provide meaningful protection is whether they ultimately lead to higher recovery rates.
- Fourth, the higher frequency with which Lower Middle Market direct lenders also extend revolving credit lines affords greater real-time transparency into borrowers’ financial health. In the UMM, it’s more often the case that lenders sell off revolving facilities to third parties, such as banks, which limits their ability to monitor companies’ daily funding needs, respond with corrective measures quickly if issues arise, and increases the potential for friction between an UMM term debt holder and the senior revolving lender.
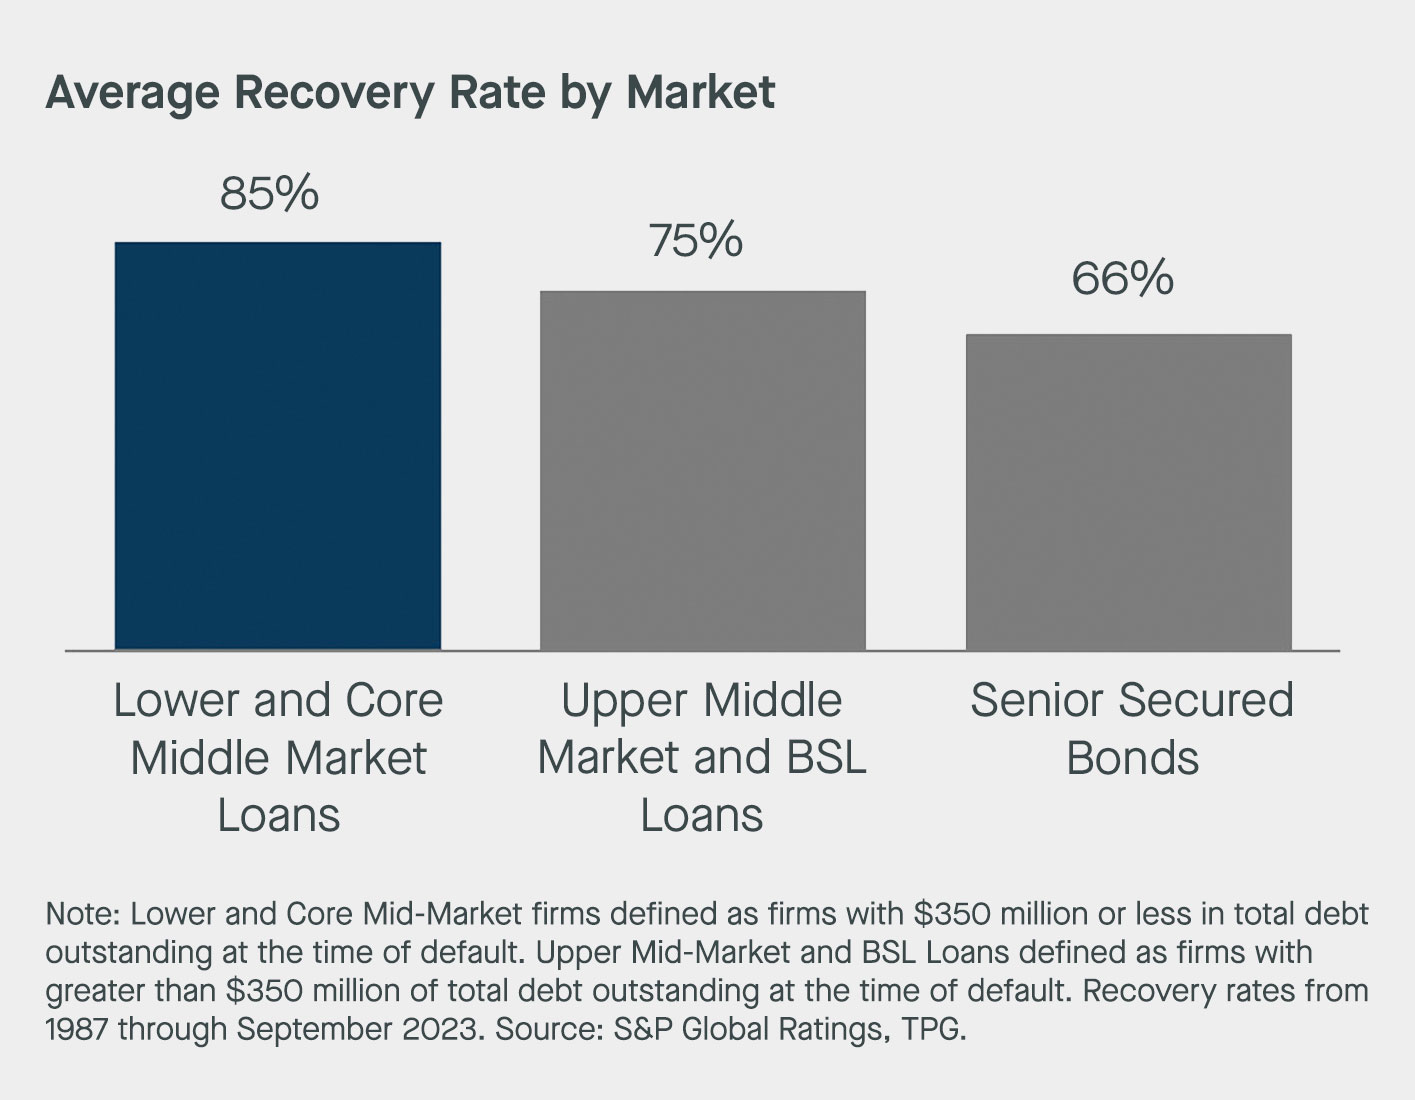
Overall, we find recovery rates are higher in the Lower Middle Market relative to the Upper Middle Market (see Exhibit 6).
We believe these higher recovery rates arise from the fact that LMM loan documents are often negotiated directly with borrowers—enabling meaningful lender protections and conservative underwriting—and given the LMM typically involves fewer lenders in each lending facility, which can allow for swifter and more amicable resolutions.
Exhibit 6: …Contributing to Higher Recovery Rates
#5. Actual Diversification Benefits
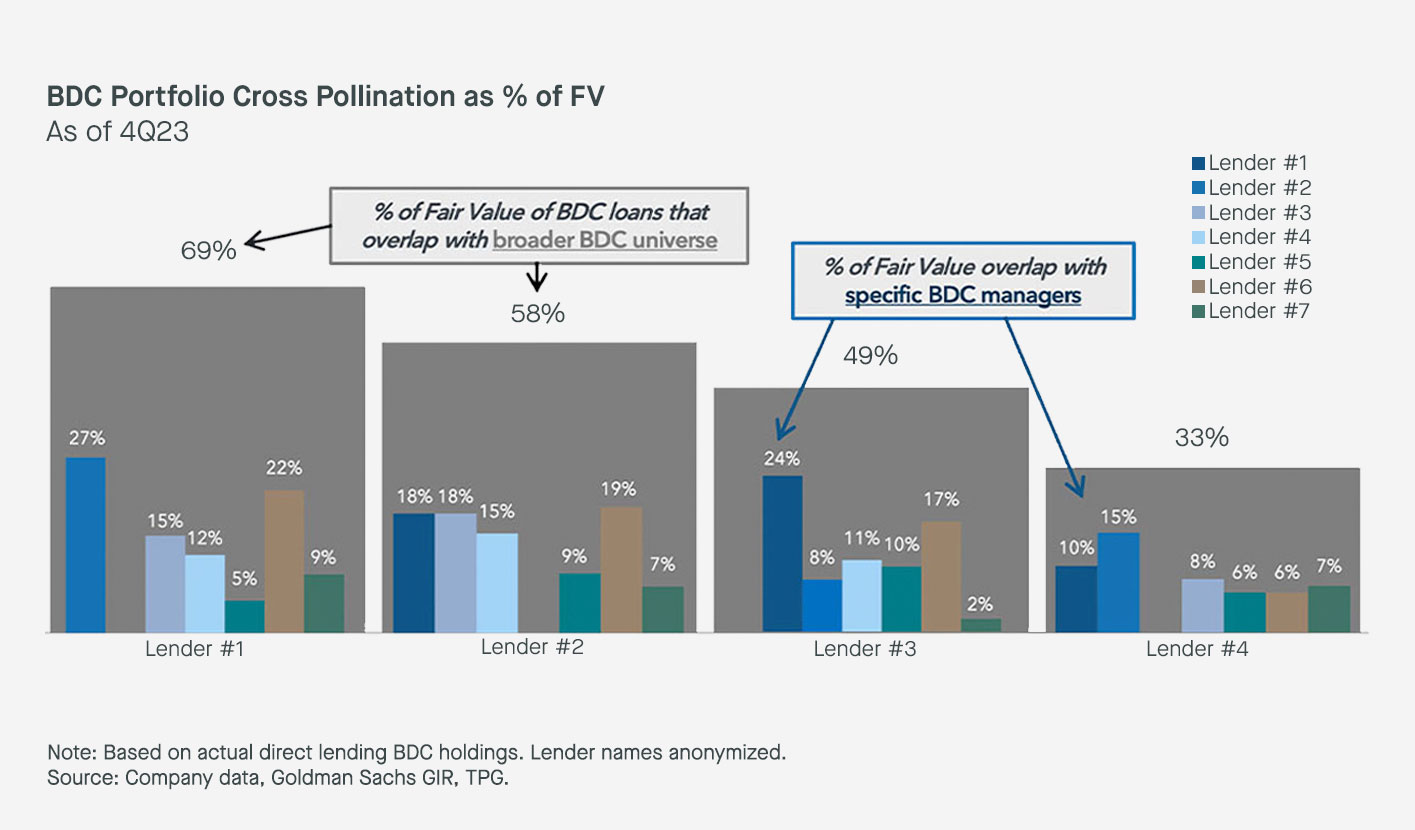
We believe Lower Middle Market direct lending also provides far more meaningful portfolio diversification relative to the Upper Middle Market, where the underlying companies and risk exposures are similar across lenders and mirror the existing universe of broadly syndicated loans (BSLs). Within the Upper Middle Market, there is a significant degree of overlap in the loan portfolios of the major direct lenders, with between 30-70% of the loans of the major BDCs also appearing in other BDCs (see Exhibit 7).
This limits the diversification benefits of exposure to multiple Upper Middle Market direct lending portfolios, in our view. In contrast, the fewer number of lenders per lending group, differentiated sourcing, and selectivity of the LLM means that it’s a far more effective source of diversification for existing direct lending portfolios and broader market exposures.
The high frequency of “club deals”, whereby a single borrower has multiple lenders, in the UMM (particularly for larger companies with >$100M of EBITDA) also means that the end investor’s exposure to a single borrower may be much larger than it appears on the surface. This can lead to a dynamic where a credit event at a single borrower can cause significant write-downs across many UMM lenders’ portfolios. We believe investing in the LMM provides prudent diversification to help mitigate this risk.
Exhibit 7: UMM BDC Portfolios Have A Significant Degree of Overlap, Reducing Portfolio Diversification Benefits
Conclusion:
We believe Lower Middle Market direct lending provides better risk-adjusted returns and greater portfolio diversification compared to the Upper Middle Market. Lower Middle Market direct lenders operate in a distinct environment from those focused on the Upper Middle Market characterized by far less competition and more acute capital needs.
While careful manager selection always remains important across both the Upper and Lower Middle Markets, we think now is the moment for asset allocators to look more actively towards the Lower Middle Market as direct lending markets continue to evolve and grow.
A Summary of Why We Favor Lower Middle Market Direct Lending:
#1. Less Competition, More Attractive Returns
#2. Larger Opportunity, More Manager Alpha
#3. Lower Leverage, Less Risk
#4. Stronger Lender Protections
#5. Actual Diversification Benefits
Disclosures
This white paper is provided for educational and informational purposes only and does not constitute an offer to sell or a solicitation of an offer to buy any securities. The contents hereof should not be construed as investment, legal, tax or other advice.
This white paper, including the information contained herein may not be copied, reproduced, republished, posted, transmitted, distributed, disseminated or disclosed, in whole or in part, to any other person in any way without the prior written consent of TPG Global, LLC (together with its affiliates, “TPG”).
Certain of the information contained herein, particularly in respect of market data, economic and other trends, forecasts and performance data, is from third-party sources. While TPG believes such sources to be reliable, TPG has not undertaken any independent review of such information.
Unless otherwise noted, statements contained in this white paper are based on current expectations, estimates, projections, opinions and beliefs of TPG professionals regarding general market activity, trends and outlook as of the date hereof. Such statements involve known and unknown risks and uncertainties, and undue reliance should not be placed thereon. Neither TPG nor any of its affiliates makes any representation or warranty, express or implied, as to the accuracy or completeness of the information contained herein and nothing contained herein should be relied upon as a promise or representation as to past or future performance.
If you believe any content, branding, information or other material incorporated into this white paper has been included in violation of applicable law, agreement, or other restriction, or that any other portion of these materials is otherwise improper, please notify us at compliance@TPG.com.
TPG
345 California St suite 3300, San Francisco, CA 94104, USA